

Crafting Compelling Stories with Data Driven Insights
Data Analysis has evolved rapidly in the world of business, making it an essential element for decision-making. This report showcases a combination of skills such as data manipulation, data visualization, and statistical analysis to create compelling dashboards. The purpose is to analyze historical sales data of a supermarket company to uncover patterns and trends that can provide valuable insights and growth opportunities. Utilizing Tableau, this report presents dynamic visualizations that not only present data in a digestible format but also encourage exploration and discovery through interactive selection features.
The dashboard includes:
A summary section displaying Key Performance Indicators (KPIs) such as total sales, cost of goods and services, profit, units sold, and customer rating. These KPIs provide a comprehensive overview of the supermarket company's performance, allowing for quick insights into its financial health, sales trends, and customer satisfaction levels.
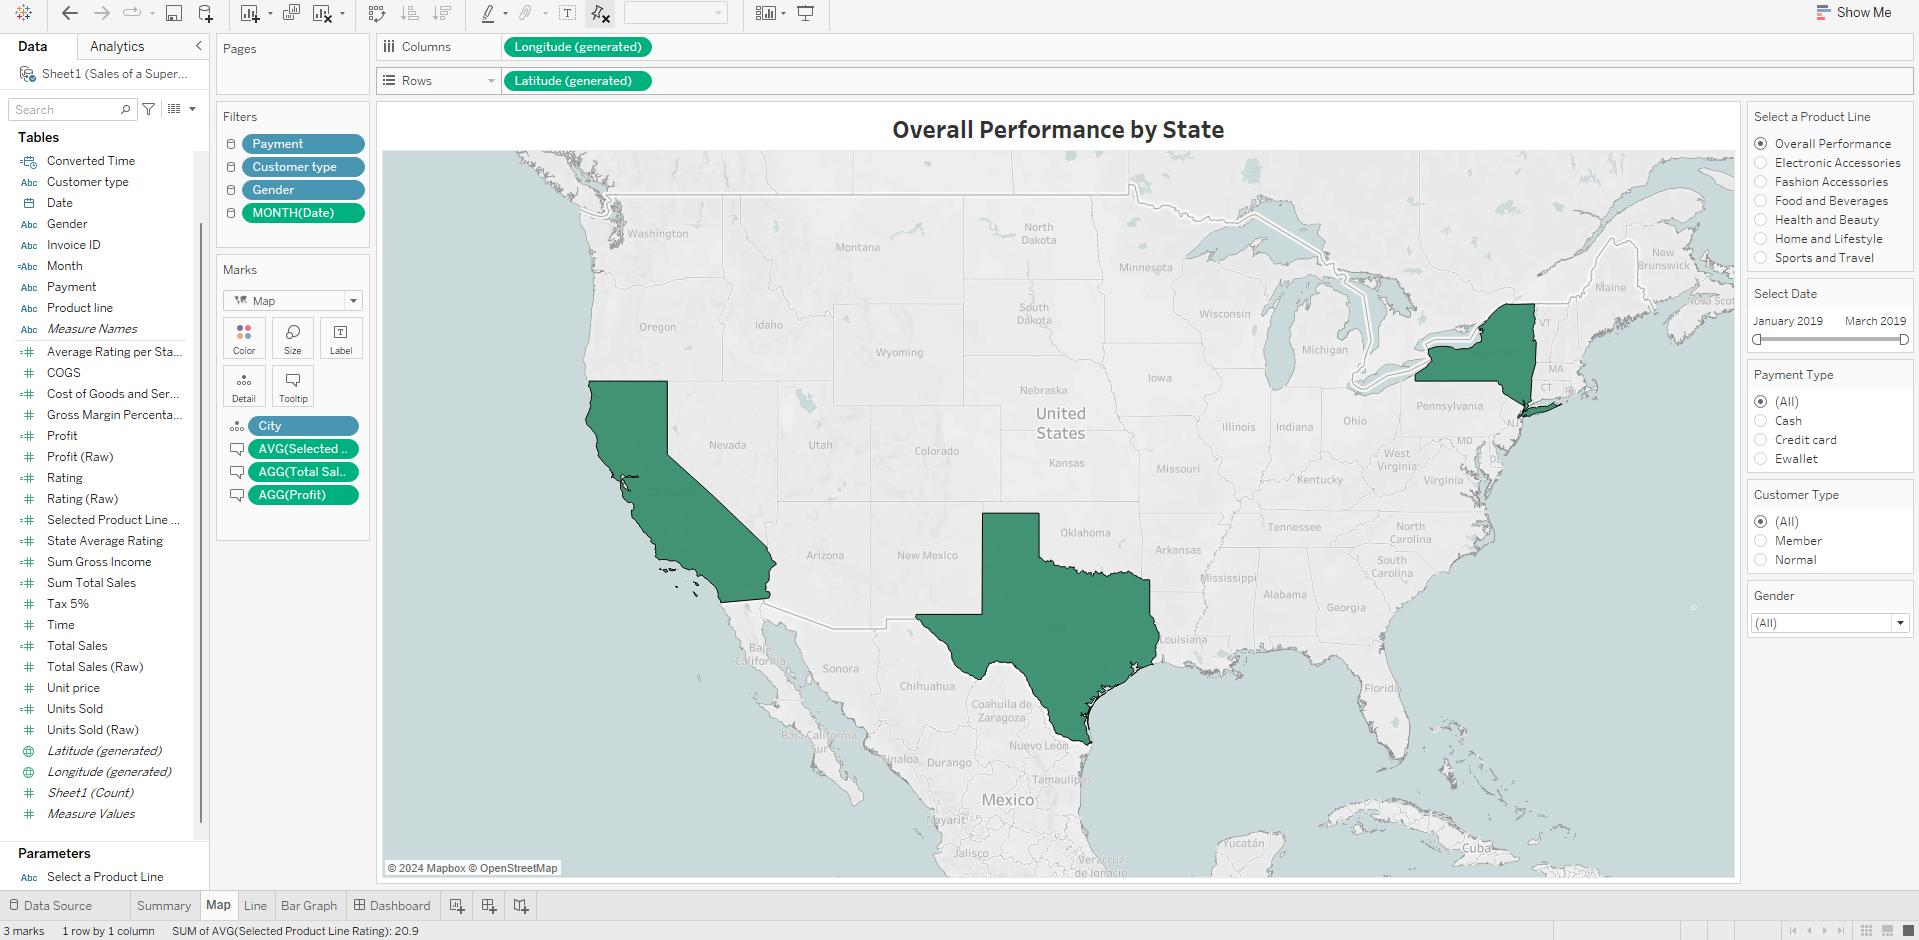
A map visualization showcasing sales, profit, and customer rating per state, enabling the identification of regional sales patterns and customer preferences.
A bar graph illustrating sales trends by hour, helping to identify peak shopping times and optimize staffing and inventory management.
A line graph depicting sales and profit trends by week, providing insights into seasonal trends and overall business performance over time.

The initial approach to this dataset involved a combination of descriptive and exploratory techniques. The dataset required addressing issues such as incorrect time and currency formatting to ensure data accuracy and consistency for presentation. Additional calculated fields were created to enhance data analysis.
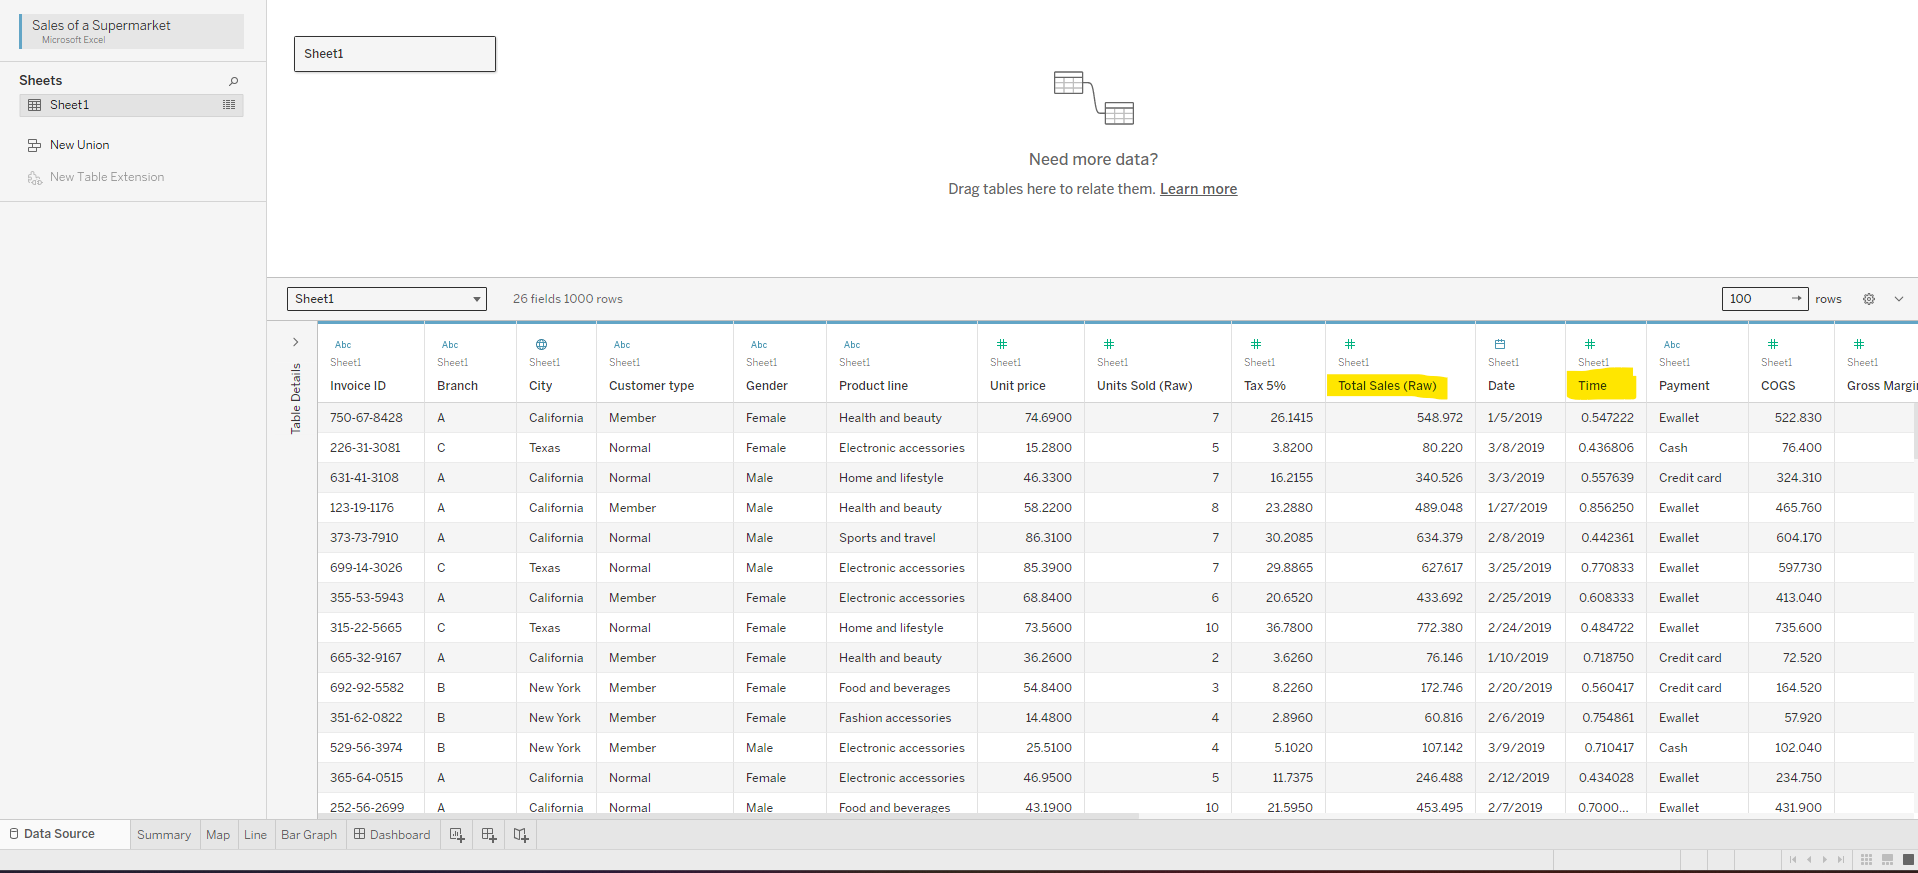
A parameter was utilized to facilitate dynamic display of information based on user selection. Filters were configured to enable interactive exploration of the data. Once the graphs and filters were created, a dashboard was designed to present key information in a visually appealing and informative manner.

Analysis:
Our analysis delves into the historical sales performance of a supermarket company across three branches over three months. The data reveals a consistent sales performance until the end of March, where a remarkable surge of over 2500% in both sales and profit was observed. The data shows that supermarkets reached an average customer rating of 7.0 across all three states, indicating a high level of customer satisfaction. Our analysis explores factors behind this exceptional performance, focusing on Data-Driven Insights, Customer Behavior, and Personalized Retention Strategies.
Data-Driven Insights:
What specific actions can we take to improve sales and customer ratings in states with lower performance, and how can we replicate the success of high-performing states in other regions?
- Overall Performance by State indicates that Texas contributes with the highest amount of sales and profit with 3.7% higher results than other states.
- Map indicates that Texas has a higher rating compared to other states by slight margin.
- The profit margin percentage of each states is 4.76% including overall performance.
Analyzing the overall performance by state reveals that Texas stands out as the top performer, contributing the highest amount of sales and profit playing a crucial role in driving the supermarket company’s profitability. Furthermore, the map visualization indicates that even while Texas boast a higher customer rating, the slight difference among other states correlates to the sales and profit performance. Additionally, the consistent profit margin percentage of 4.76% across all states underscores the company’s effective cost management and pricing strategies, ensuring profitability across its operations.
Customer Behavior:
How can we tailor marketing strategies to better appeal to the specific preferences and buying behaviors of Member vs. Normal customers?
- Profit margin of Member vs Normal customers remains at 4.76% while the sales for Members is 3.4% higher over the three month period.
- Data shows that Normal customers purchased more Electronic Accessories than Members who purchased more Food and Beverages.
- Based on peak hours of each product line, data shows that majority of Members and Normal customers are shopping after 5PM.
Analyzing the behavior of Member vs. Normal customers reveals valuable insights. Despite differences in sales volume, both customer segments maintain a consistent profit however, sales for Members are higher over the three-month period. Majority of customers from both segments are shopping after 5PM, indicating an opportunity to target promotions and adjust staffing levels during peak hours.
Personalized Retention Strategy:
How can data from the loyalty program can be used to personalize offers and promotions for individual customers?
- Sports and Travel is second most selling product line for Members but they feel less satisfied giving it the lowest rating of 6.8 but are happier in the Health and beauty products with a 7.1 average rating.
- Data indicates that female Members drive higher sales than Males by 17% and spend more on Food and Beverages with peak hours 6-8 pm.
- The spending per payment type is relatively among Members but most of them purchased Sports and Travel with their credit card.
Analyzing the behavior of Member customers reveals actionable insights that can be used to personalize offers and promotions. Despite being the second most selling product line for Members, Sports and Travel products receive the lowest rating indicating a potential dissatisfaction among customers. To improve customer satisfaction, personalized offers and promotions can be tailored to this product line, such as discounts on related accessories or exclusive travel packages for loyal customers. Female Members are driving higher sales under Food and Beverages gives us an opportunity to offer special dinner packages or cooking workshops. While spending per payment type is relatively consistent with a slight lead in credit cards, personalized promotions can be offered to Members who use their credit cards for these purchases, such as cashback rewards or bonus points.
Conclusion:
Analyzing the supermarket company’s performance reveals Texas as the top performer, driving sales and profit, with customer ratings closely tied to sales. While maintaining a consistent profit margin across states, the company demonstrates effective cost management and pricing strategies. Customer behavior analysis indicates higher sales from Members, particularly in the evening, suggesting targeted promotions during peak hours. To improve customer satisfaction, personalized offers can be tailored for Sports and Travel products, which despite being a top seller among Members, receive the lowest rating. Female Members, driving higher sales in Food and Beverages, present an opportunity for specialized promotions. Additionally, encouraging credit card use for purchases, especially in Sports and Travel, can further enhance customer retention through cashback rewards or bonus points.
Feel free to reach out if you have any questions or additional feedback. Lets Connect!
Disclaimers: Dataset used for this project can be found in Kaggle. The cities from the actual sheet were modified into US States in order to provide clear visibility in the dashboards.